Download
Fiche technique
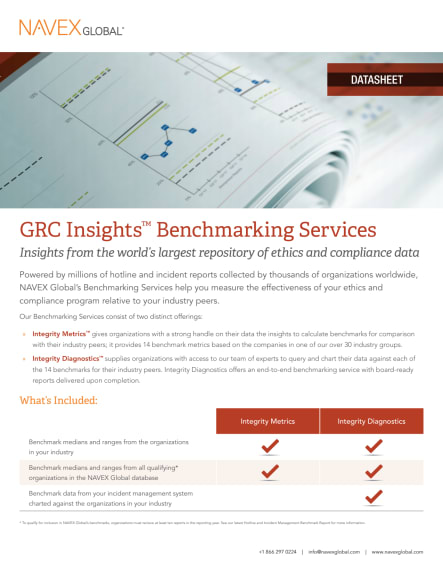
Services d’analyse benchmark comparative
TéléchargerÀ propos Fiche technique
Pour les entreprises qui recherchent un outil de benchmark personnalisé, NAVEX propose une analyse encore plus approfondie pour vous aider à mesurer l’efficacité de votre programme d’éthique de de conformité et ainsi, à identifier vos lacunes et vos opportunités.
- For anyone responsible for:
- Ethics and compliance program management
- What you'll learn:
- What the two distinct compliance benchmarking offerings are within NAVEX’s Custom Benchmarking Services
- The key features, metrics and benefits of custom compliance benchmarking and the valuable insights your organization will gain
- ns that received 10 or more reports in a given reporting year
- Medians or midpoints (rather than averages) to limit the impact of outliers
- Central ranges that cover the middle 80 percent of data points to provide a contextual range of values and further limit the impact outliers
Lire Fiches techniques
About NAVEX
NAVEX’s GRC software and compliance management solutions support the integrated risk, ESG and compliance management programs at more than 13,000 organizations worldwide.