
Skip to content.
Datasheet

NAVEX One Incident Benchmarks Report

Benchmark your incident management performance with NAVEX One Incident Benchmarks Report to uncover trends, risks, and improvement opportunities.


Available in
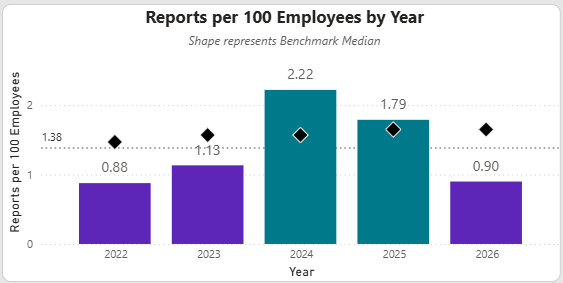
A dashboard showing a substantiation rate of 57, anonymous reporting rate of 17, and median days to close at 133. Each metric compares to 2025 benchmarks. A bar chart compares key metrics to 2025 industry benchmark values.

Put incident management performance into context

Your incident data tells you what’s happening. Benchmark data tells you what it means. 

The NAVEX One Incident Benchmarks Report brings trusted benchmark intelligence directly into NAVEX One, helping risk and compliance teams understand program performance, identify trends and make more informed decisions. The report also enriches Nira for Analytics, enabling users to ask natural language questions and gain AI-powered insights backed by trusted benchmark data. 

Built on the NAVEX annual Whistleblowing & Incident Management Benchmark Report, one of the world’s largest workplace reporting datasets, the Incident Benchmarks Report combines your organization’s incident data with NAVEX benchmark intelligence to deliver meaningful context where compliance work already happens. 

Instead of manually comparing reports or analyzing spreadsheets, your compliance team can quickly understand how your program is performing, where risks are emerging and where opportunities exist to strengthen reporting culture and program effectiveness.


A person typing on a laptop at a desk, with a smartphone and papers nearby. The person is wearing a bracelet and a ring, and the setting appears to be a bright, modern workspace.

Turn data into better decisions

Knowing your metrics is important. Understanding how they compare, and what they may be signaling, is even more valuable.

The Incident Benchmarks Report helps answer questions like:

  • How does our program compare to organizations like ours?
  • Are reporting behaviors changing over time?
  • Are anonymous reporters staying engaged?
  • Are our investigations becoming more effective?
  • Where should we focus our improvement efforts?

By combining organizational data with trusted NAVEX benchmark intelligence, compliance teams can move beyond operational reporting and make more confident, data-driven decisions.

Key capabilities

Benchmark organizational performance

Compare your incident management performance with historical benchmark data from the NAVEX annual Whistleblowing & Incident Management Benchmark Report, including benchmark data from 2022 through the latest report published in 2026.

Benefits include:

  • Benchmark your program against trusted industry data.
  • Measure progress over time.
  • Add context to reporting trends.
  • Identify opportunities for continuous improvement.

Analyze the metrics that matter

Monitor the metrics that provide the clearest view of program health, helping you identify emerging risks, evaluate reporting culture and improve investigation effectiveness.

Gain insight into:

  • Reporting trends
  • Intake methods
  • Allegations and inquiries
  • Anonymous reporting and follow-up
  • Report outcomes
  • Case timelines
  • Reporter categories

Strengthen executive reporting

Support executive and board conversations with trusted benchmark intelligence that explains performance, validates program maturity and helps guide strategic decisions.

Use benchmark data to:

  • Add credibility to executive reporting.
  • Explain trends with confidence.
  • Support strategic planning.
  • Demonstrate continuous improvement.
A woman in a red turtleneck uses a tablet in a modern, blue-lit office environment, with motion blur effects in the background suggesting technology and speed.

Unlock richer AI insights with Nira for Analytics

The Incident Benchmarks Report extends the value of Nira for Analytics by incorporating trusted benchmark intelligence into AI-powered analysis.

Ask questions in natural language and quickly:

  • Compare your organization’s performance with benchmark data.
  • Identify trends and emerging risks.
  • Interpret incident data with greater context.
  • Turn questions into actionable insights.

Compliance doesn’t have to be complicated. 

Ready to take the next step in your risk and compliance journey?