
Regional Whistleblowing & Incident Management Benchmark Report
Regional Whistleblowing StatisticsAvailable in
- US
- UK
What you’ll learn from our 2025 Regional Whistleblowing & Incident Management Benchmark Report
Our 2025 Regional Whistleblowing & Incident Management Benchmark Report includes the largest-ever dataset of NAVEX customers that received 10 or more internal reports. This group of over 4,000 organizations representing nearly 70-million employees logged 2.15 million reports in 2024.
These reports represent a treasure trove of data points to inform the insights internal reporting program managers use to understand the successes, opportunities, cultural health and risks within their organizations. We are pleased to report that 87% of NAVEX customers included in last year’s report are present for this year’s analysis, strengthening the understanding of year-over-year trends.
Our database – the world’s largest by far – and our rigorous analysis process, give readers confidence in these benchmarking metrics.
Our analysis covers four regions: North America, South America, Europe and Asia Pacific (APAC). This provides a region-specific avenue for readers to consider how deviation from statistical norms might inform opportunities to improve their programs.

Methodology
For statistical accuracy, our analysis includes only organizations that received 10 or more reports in 2024. To remove the impact of outliers that might skew the overall reporting data, we calculate each benchmarking metric by organization, then identify the median (midpoint) across the total population.
NAVEX’s full 2025 Regional Whistleblowing and Incident Management Benchmark Report represents an exhaustive analysis of 10 different benchmarking metrics across four global regions, with most metrics depicted by both headquarters region and region of report origination.
Report Volume: Whistleblower reporting levels vary significantly across regions
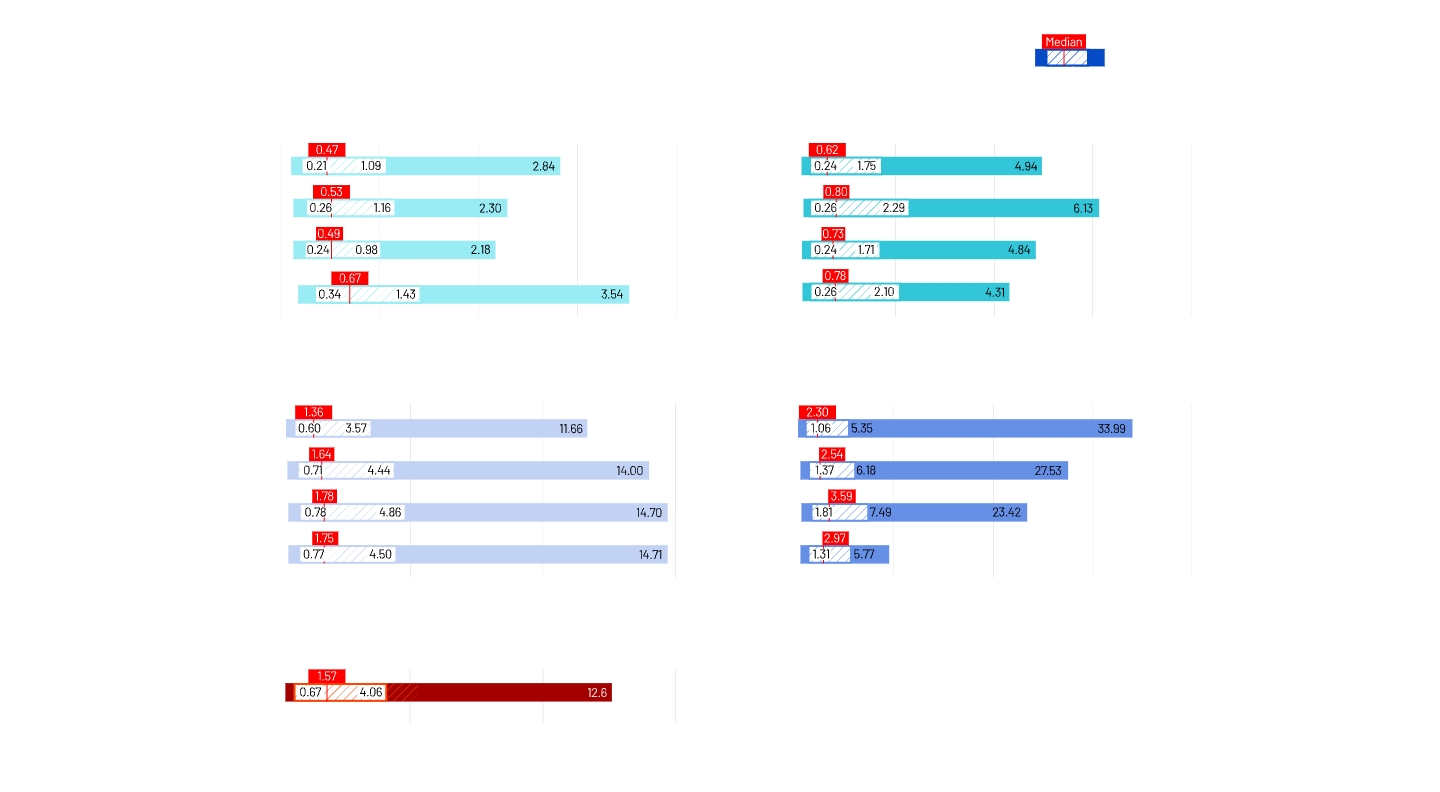
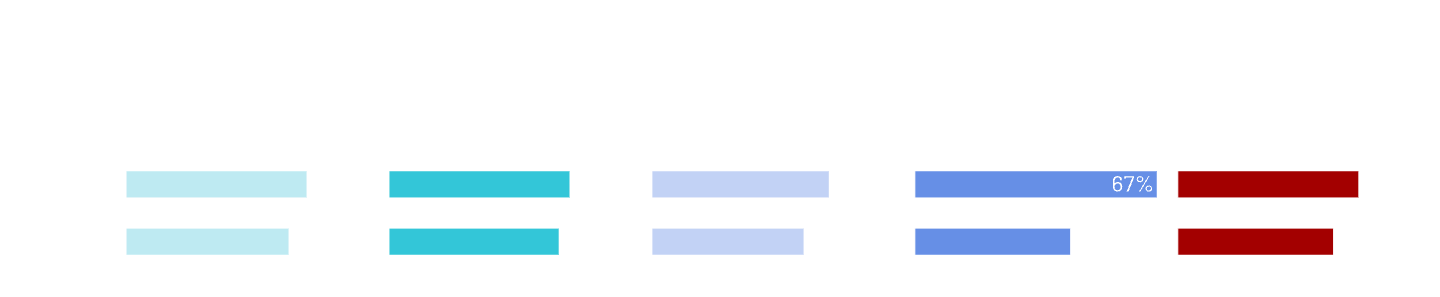
As we have found in past years, report volume is vastly different across the regions, and a closer look at Reports per 100 Employees by region yields yet more interesting insights. In Europe, the median Reports per 100 Employees was 0.67, in APAC it was 0.78, South America was highest at 2.97, and in North America, it was 1.75. So, while the global median of Reports per 100 Employees is 1.57, the breakdown by region may provide more valuable localized insights into report volume benchmarks that more accurately reflect your organization’s trends.
All four regions in our analysis have seen a general increase in median Reports per 100 Employees over four years. When comparing 2023 and 2024, Europe saw the largest increase (0.49 to 0.67) to the highest reporting levels we have seen for this region. South America-based organizations saw a decline, though we caution that this represents the smallest cohort in this data set where outliers can have a relatively significant impact. North America and APAC were largely stable.
Risk Categories: No matter where you are in the world, at least half of your whistleblowing reports will be about Workplace Conduct
Workplace Conduct refers to reports concerning employee relations or misconduct. This includes Discrimination, Harassment, Workplace Civility, Retaliation, Compensation and Benefits, Substance Abuse, and Other HR-related issues. Globally, this Risk Category accounted for 54% of reports made in 2024.
Workplace Conduct reports are substantiated at a similar rate to the median of all other reports, though consistently lower than the overall median Substantiation Rate. In Europe, Workplace Conduct was substantiated at 43% (compared to the overall global Substantiation Rate of 47% for all matters), in APAC at 44% (48% overall), and North America at 40% (45% overall). The volume of Workplace Conduct reports we see indicates that many of the concerns being raised are valid – and given the inexorable tie to culture, should be carefully monitored as it can be a strong indicator of a culture in need of attention.
We note that many organizations consider these types of reports to be “not a compliance issue” and often refer them to Human Resources for review without further tracking or follow-up from the compliance team. Given the relationship between these matters and organizational culture, we encourage organizations to track these matters in the same way all other cases are tracked and include them in any assessment evaluating risk in a specific location or line of business.
Retaliation and Substantiation
Retaliation cases far more likely to be substantiated outside North America
Readers of this report are likely to know Retaliation is the nemesis of internal reporting programs. When reporters feel there is a risk of retaliation in making a report, they don’t report. While Retaliation is a relatively small median share of reported misconduct globally, its outsize impact always makes it worthy of note.
North America-based organizations showed the greatest frequency of Retaliation reporting among regions in 2024 (1.16%, followed by Europe at 0.87%). We also see significant differences in the Substantiation Rate between North America and Europe regarding Retaliation cases. By headquarters region, Europe substantiates Retaliation cases at 32% – nearly double the rate of North America which achieved a four-year high of Retaliation substantiation of 17% in 2024; APAC has a Substantiation Rate for Retaliation reports of 28% for 2024.
In fact, compared to all regions evaluated in this report, companies with headquarters in North America have the lowest Substantiation Rate, marking a notable trend across regions that warrants further discussion. This data invites consideration of whether North America-based organizations are investing enough time and resources in investigation of Retaliation cases.
Report Outcomes
North America-headquartered companies more likely to terminate employment
Our report looks at outcomes or actions taken resulting from a case that is substantiated all or in part. These outcomes include No Action, Training, Policy/Review Change, Discipline, and Separation of employment. Resulting actions from reports and investigations also shed light on the most common outcomes and the ways they vary globally.
Companies headquartered in North America saw Separation of employment at a rate of 20.6% for substantiated cases in 2024; in Europe, Separation occurred in 15.1% of substantiated cases and 14.5% in APAC. Europe and North America-headquartered companies are more aligned on Discipline as a report outcome for substantiated cases, at a frequency of 30.7% and 30.6% respectively.
However, and perhaps more concerning is the rate of No Action for substantiated cases. Globally, this was the outcome for 14.4% of substantiated cases, with APAC leading the No Action report outcome at 19.4%. Taking no action as a result of a substantiated report has the potential to chill internal reporting.
Time Difference Between Incident and Report Date: North America-headquartered companies report sooner
There are myriad reasons why a reporter may choose to wait to make their report, but generally speaking a shorter gap is preferable so that investigations can begin, and misconduct can be addressed more quickly.
Organizations based in Europe and APAC marked median decreases in Time Difference Between Incident and Report Date when comparing 2023 and 2024. In Europe, the median Time Difference Between Incident and Report Date was 13 days, for APAC it was 12. Meanwhile, North America remained consistent with the lowest median time difference at eight (8) days – the only region to have a single-digit date difference between incident and report date.

Case Closure Time shows regional differences; global similarity in Substantiation Rate
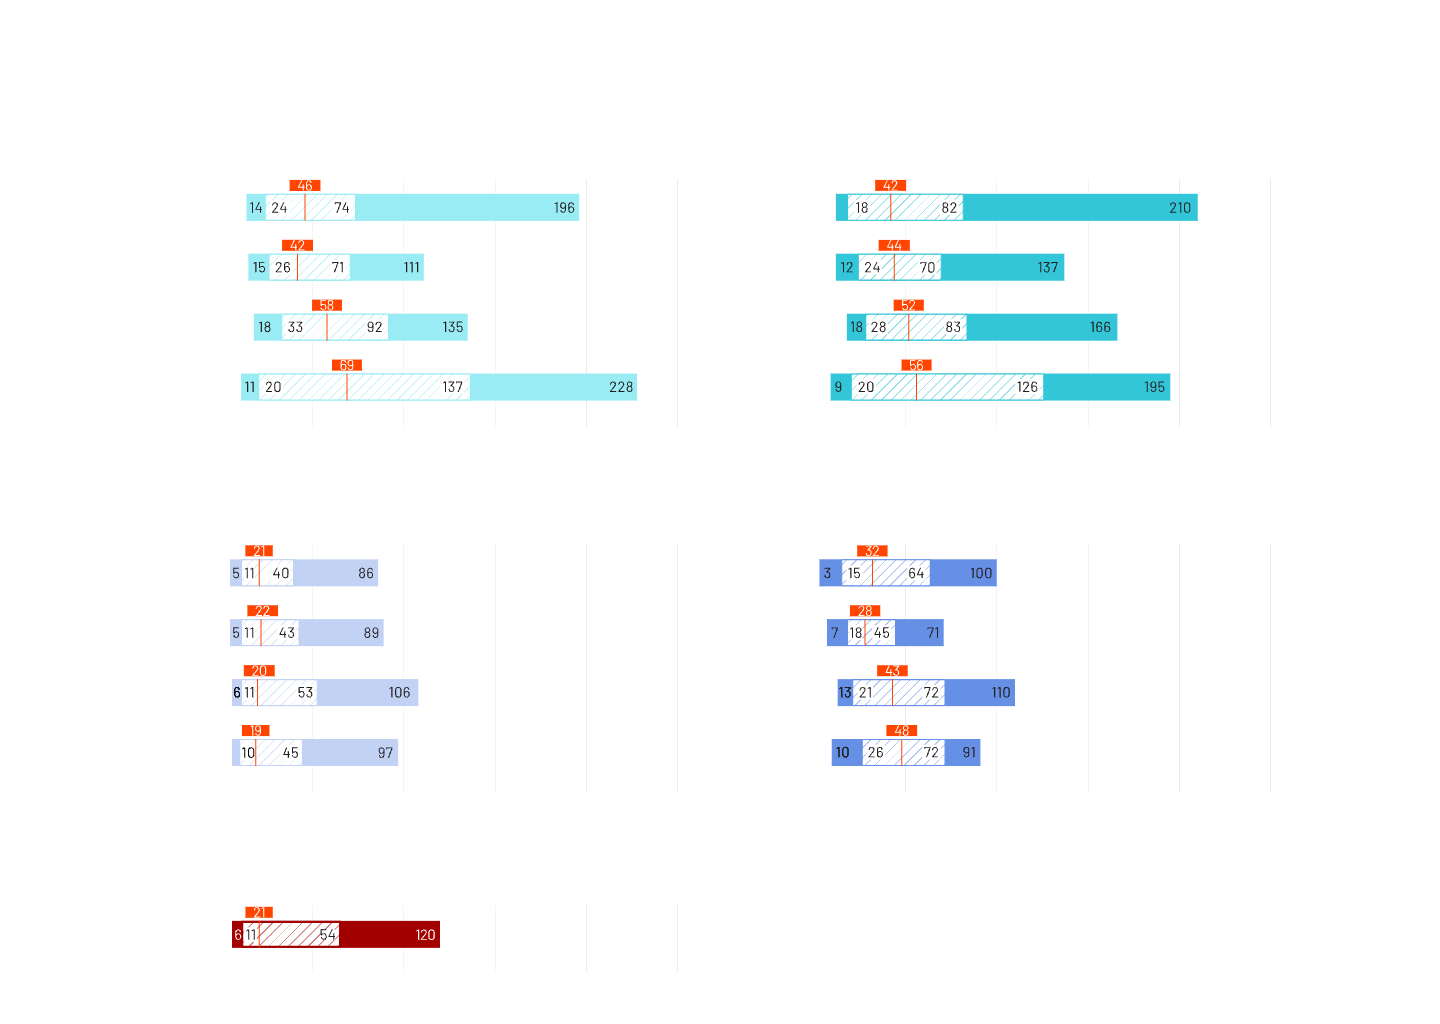
Time between incident and report date is not the only area where North America has a more expedient pace. The median Case Closure Time for North America of 19 days in 2024 presents a noteworthy difference from Europe at 69 days and APAC at 56 days.
An interesting comparison can also be made between Case Closure Time and Substantiation Rate across the regions. And we note here that our global report found Substantiation Rates hit a record high of 46% overall. Europe and APAC have the highest Substantiation Rates, coming in at a median of 47% for Europe and 48% for APAC, but North America is not far behind at 45% – and with a much shorter median Case Closure Time. The Substantiation Rates are within a marginal range, but the Case Closure Times are far less consistent across regions with the difference between North America and Europe being 50 days.
The bottom line: Europe-headquartered companies take far longer than other regions to investigate and close reports, and substantiation is still fairly consistent when compared to other regions. It may be worth examining the confluence of Europe receiving fewer reports, taking longer to investigate, but substantiating at only a marginally higher rate than other regions. The exception in 2024 was Europe where only 25% of the cases in the small (0-2,499 employees) organizations were substantiated. Small organizations may wish to review this finding and ensure that investigative processes are effective.
Anonymous reports: North America-based companies are less likely to receive anonymous whistleblower reports
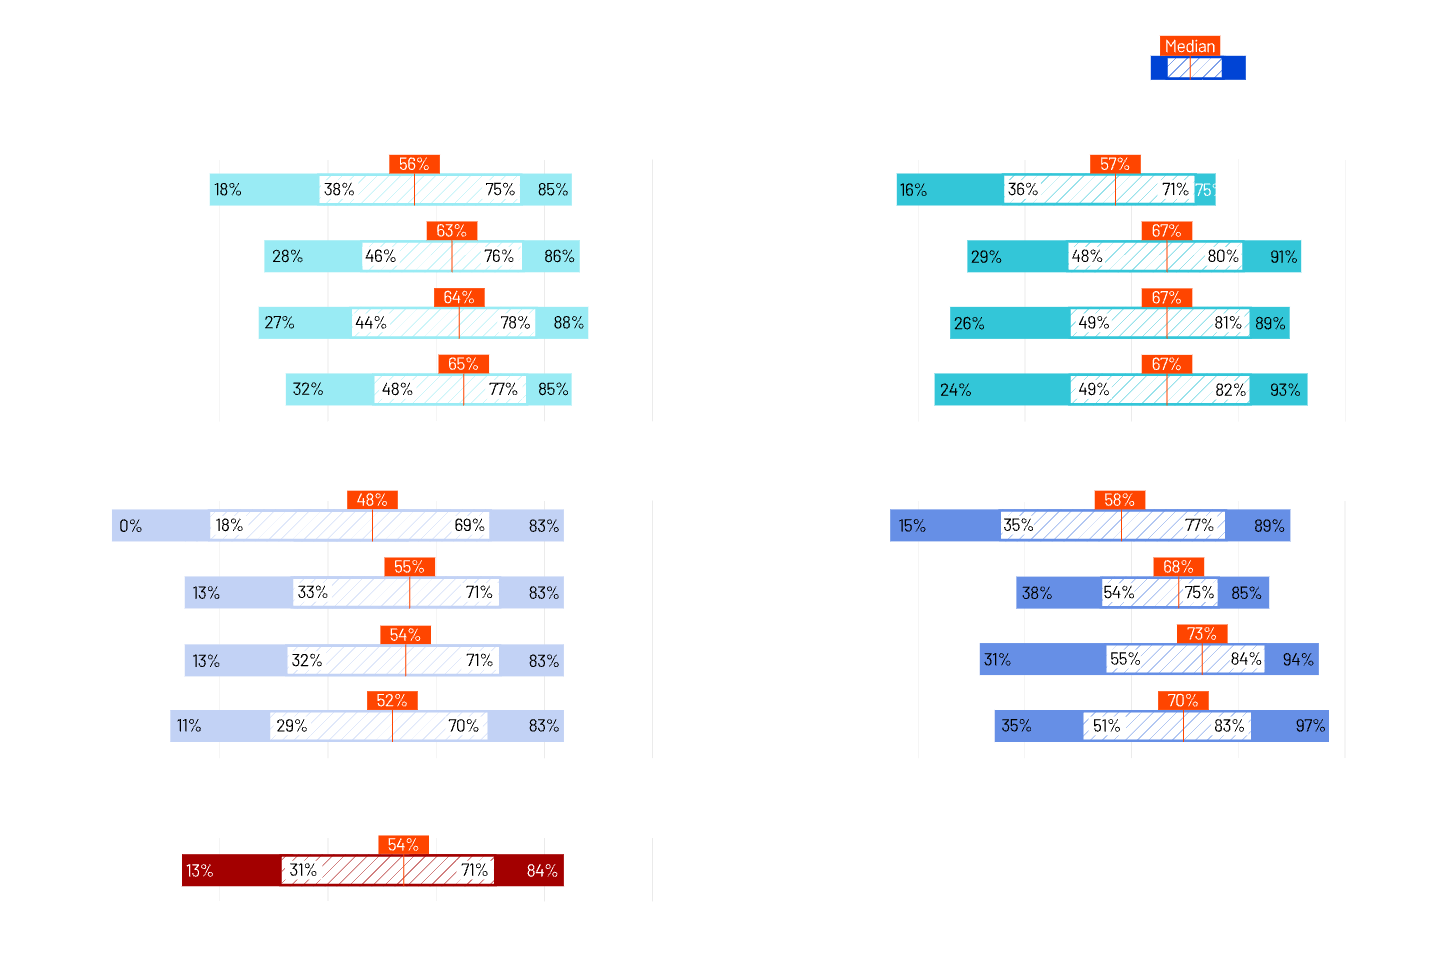
Trending up since 2021, Anonymous Reporting Rates provide valuable insight into the level of comfort with speaking up, and a belief by reporters that they will not face retaliation. Anonymous reports in North America make up just over half of all reports, at 52%; in other regions, that number is far higher, sitting at 65% in Europe and 67% in APAC.
However, having about half-to-two-thirds of reports come in anonymously does not seem to have a huge impact on overall Substantiation Rates, as those rates are relatively consistent and within a couple of percentage points across all regions year-over-year.
One area, however, where anonymous reports likely have an outsized impact is in Case Closure Time. Europe and APAC have the highest median rates of Anonymous reports (65% and 67% respectively) and also have the highest median Case Closure Times (Europe 69 days, APAC 56 days). It is well known that unnamed reports are more challenging to investigate, but are not without merit and are often substantiated, particularly those received via a web-based reporting mechanism. But the higher rate of anonymous reporting in Europe and APAC may be a contributing factor to longer Case Closure Time in these regions when compared to North America.
Substantiation Rate: Significant differences between privately held and public companies
New this year, and in response to customer requests from prior years, we analyzed internal reporting data for different structures of company ownership to show how reporting metrics differ within these groups. For this regional report, we evaluated key reporting metrics for private and publicly held companies and found that privately owned companies are more likely to substantiate reports across the board, with Europe and APAC at 50%, North America at 49% and South America at 67% substantiated. This is contrast to public companies where the Substantiation Rate was below 50% for all regions – Europe at 45%, APAC at 47%, North America at 42% and South America at 43%.
In addition to differences in Substantiation Rate, we also saw differences in median Reports per 100 Employees between private and public companies. While Europe was largely similar, at 0.67 Reports per 100 Employees for private and 0.66 for public, the other regions had very different results. In APAC, the median Reports per 100 Employees for private organizations was 1.06, but for public companies the reporting volume was half that at 0.53. In North America, private companies reported at 2.12 Reports per 100 Employees, while public companies came in at 1.27 Reports per 100 Employees.
This is another area worth further examination. What factors lead to a smaller relative number of reports being made in publicly owned organizations versus privately owned companies?
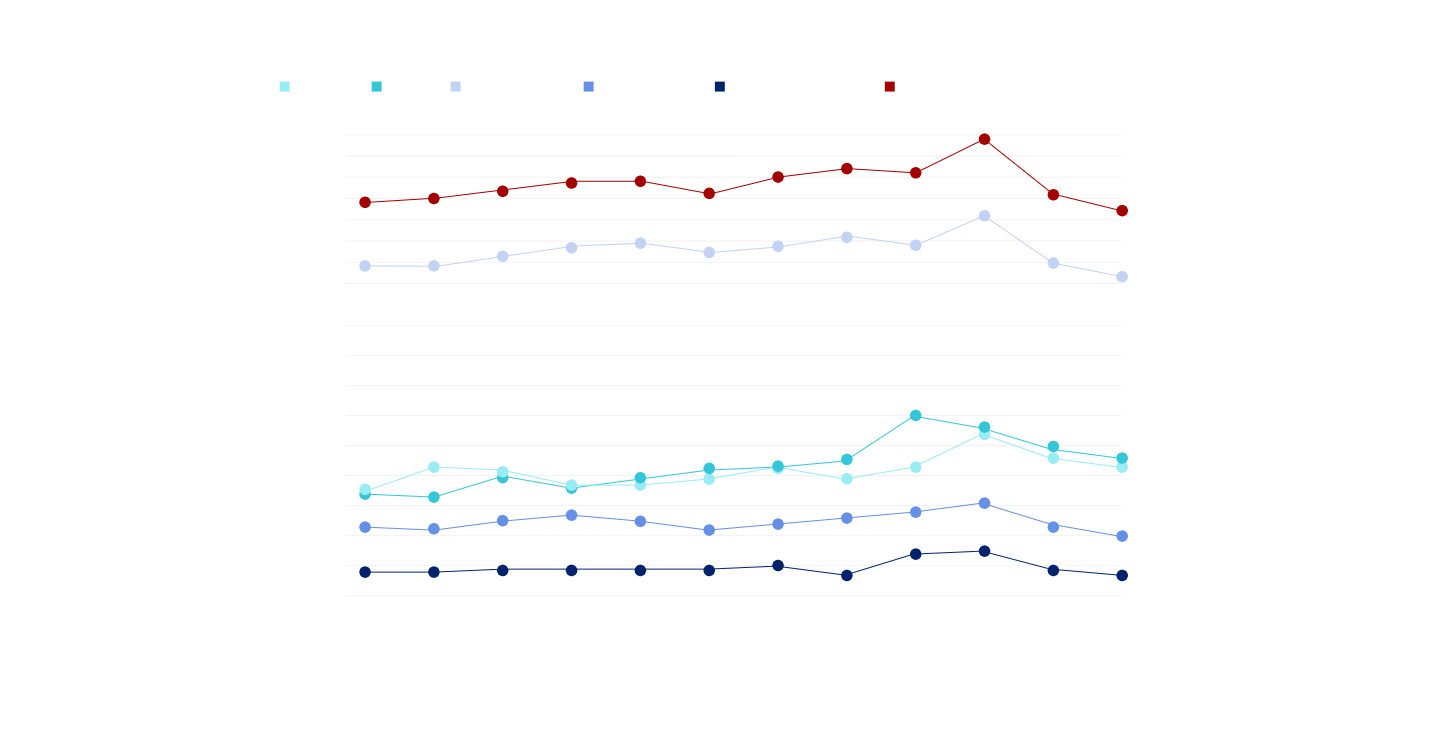
Timing trends: Whistleblowing reporting spikes consistently in October across all regions
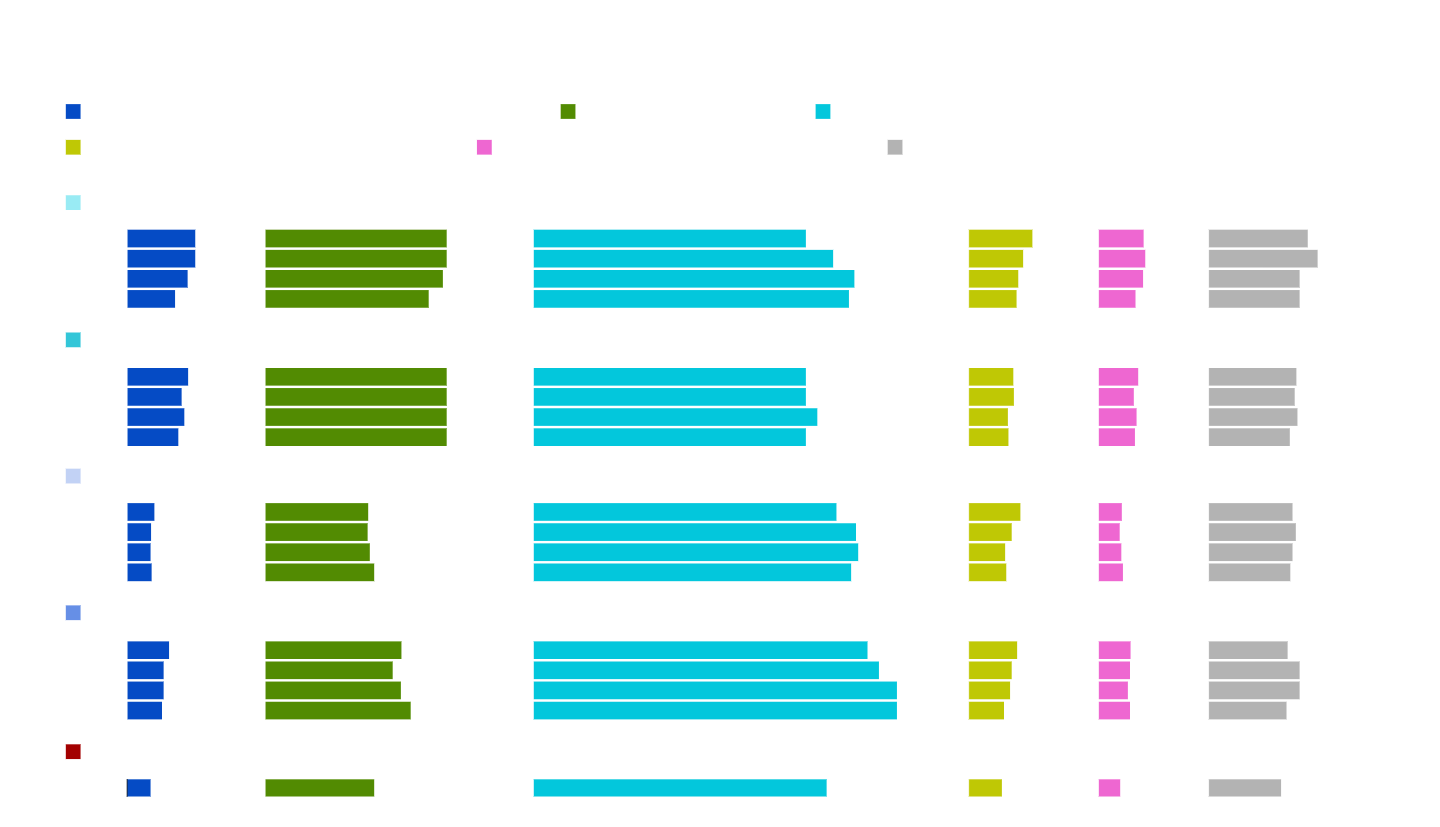
For several years, October has proven to be a consistent month where we see a spike in reporting volume as compared to the rest of the year. This trend is most prominent in North America, where there is a regular spike in reporting in October, followed by a decline in reporting volume as the year closes.
Other regions see a similar uptick in reporting around the same period, but the jump is far less pronounced. In Europe and APAC, we also see a dip in reporting in the summer months, followed by a peak in October as well. Obviously, holiday vacations play a role in the lower summer volumes, but we suspect that there are a variety of reasons for the annual October spike. These may include pressures on fourth quarter results, timing of training rollout, timing of national elections or launch of annual employee surveys.
Report Intake Method: Regional differences are more pronounced
The channel by which reports are made also illustrates noteworthy regional differences. Our report looks at reports received via a phone channel (Hotline), Web-based reporting, and “Other” which can be walk-ins to compliance or human resources. In North America, by frequency, the Hotline (phone) is used for 31% of reports – significantly above Europe (18%) and even more than APAC, which uses the Hotline for only 11% of reports.
In fact, North America is relatively equal across reporting channels by frequency; 31% of reports are made via the Web and 38% via Other. This is quite the contrast from other regions, where Europe has 57% of reports made through the Web and 25% through Other. APAC has even greater Web adoption at 62%, and 28% in Other.
This trend is even more interesting when you consider additional regional differences with the Substantiation Rate for the various intake methods. For example, Europe has the lowest Substantiation Rate for Other, which includes walk-in reports, at only 54%. In APAC, Other has a Substantiation Rate of 67% and North America is at 61%.

Conclusion and Key Recommendations
Tips and key takeaways to maximize your whistleblowing program
The metrics in this report empower organizations to better understand how to grow and improve their internal whistleblowing reporting and investigations programs. Our final analysis offers a few key actions to consider – actions that in many ways are timeless examples of how to promote an effective internal reporting program.
Meet the authors

Carrie Penman
Chief Risk & Compliance Officer
NAVEX

Eric Gneckow
Senior Content Marketing Manager
NAVEX

Andy Harmsen
Associate Data Manager
NAVEX

Isabella Oakes
Data Scientist Specialist
NAVEX

Anders Olson
Senior Manager, Data Science
NAVEX
See more reports in this series

Reports
2025 Whistleblowing Statistics & Benchmarking
This NAVEX report shares whistleblowing statistics, key findings and recommendations from an analysis of the world’s largest whistleblowing reporting database.
Learn more

Reports
2025 United States Whistleblowing Benchmarking Statistics
More than 20 years after the landmark SOX Act, data regularly shows the U.S. as having some of highest rates of internal whistleblowing reporting globally.
Learn more

Reports
2025 United Kingdom Whistleblowing Benchmarking Statistics
How have the UK Corporate Governance Code and related guidance impacted whistleblowing reporting? See the latest UK whistleblowing statistics in this report.
Learn more

Reports
2025 Whistleblowing Benchmarking Statistics in Europe
How has the EU Whistleblower Protection Directive impacted whistleblowing reporting? See the latest European whistleblowing statistics in this data-packed report.
Learn more

Reports
2025 Whistleblowing Benchmarking Statistics in Asia
How have the Whistleblower Protection Act and similar laws impacted whistleblowing reporting? See the latest Asia-Pacific whistleblowing statistics in this report.
Learn more