

Board-level and ready-to-use hotline benchmark metrics deck
Compare your reporting data to global whistleblowing and incident management benchmarks using editable, presentation-ready charts – plus regional insights for deeper analysis.
Compare your reporting data to global whistleblowing and incident management benchmarks using editable, presentation-ready charts – plus regional insights for deeper analysis.
Enter your own data and instantly compare against NAVEX global median benchmarks, with regional data included to compare across geographies.
Focus on the hotline and investigation KPIs boards and auditors expect to see, based on the latest benchmark data.
Drop charts directly into board, audit committee, or year-end compliance decks.

A strong compliance program depends on trusted reporting and effective investigations, but without benchmarks, it’s difficult to prove performance or identify gaps.
This deck distills insights from the largest global database of internal reporting activity into five essential metrics, alongside regional benchmarks that highlight meaningful differences in reporting patterns and performance.
You’ll use this resource to:

This deck gives you a snapshot. NAVEX Whistleblowing and Incident Management data helps you continuously track, analyze, and report on these same benchmarks – globally and by region – directly from your reporting system.
With Incident Management, you can:

Customer Story
From regional hotlines to a globally connected speak-up program: BASF strengthens trust, transparency and compliance with NAVEX – and makes speaking-up more accessible for employees in manufacturing and operational roles.
See their story

Webinar On-Demand
Join us for a fresh, practical demo to see the latest from Nira and discover how purpose-built AI can help you capture clearer information at intake, find trusted answers, make sense of compliance data and take some of the legwork out of everyday compliance. We’ll also zoom out to the bigger picture, exploring how Nira fits into NAVEX’s wider approach to AI and what’s coming next. Have a question or compliance challenge? Submit it when you register and we may explore it live.
View on demand

Use Case
Create a code that you are proud to share.
Get the use case

eBook
Even well-designed speak-up programs can lose credibility when investigations drag on, communication breaks down or employees fear retaliation.
Download this ebook to uncover seven common mistakes that undermine reporting confidence – and practical ways to build greater employee trust.
Get the eBook
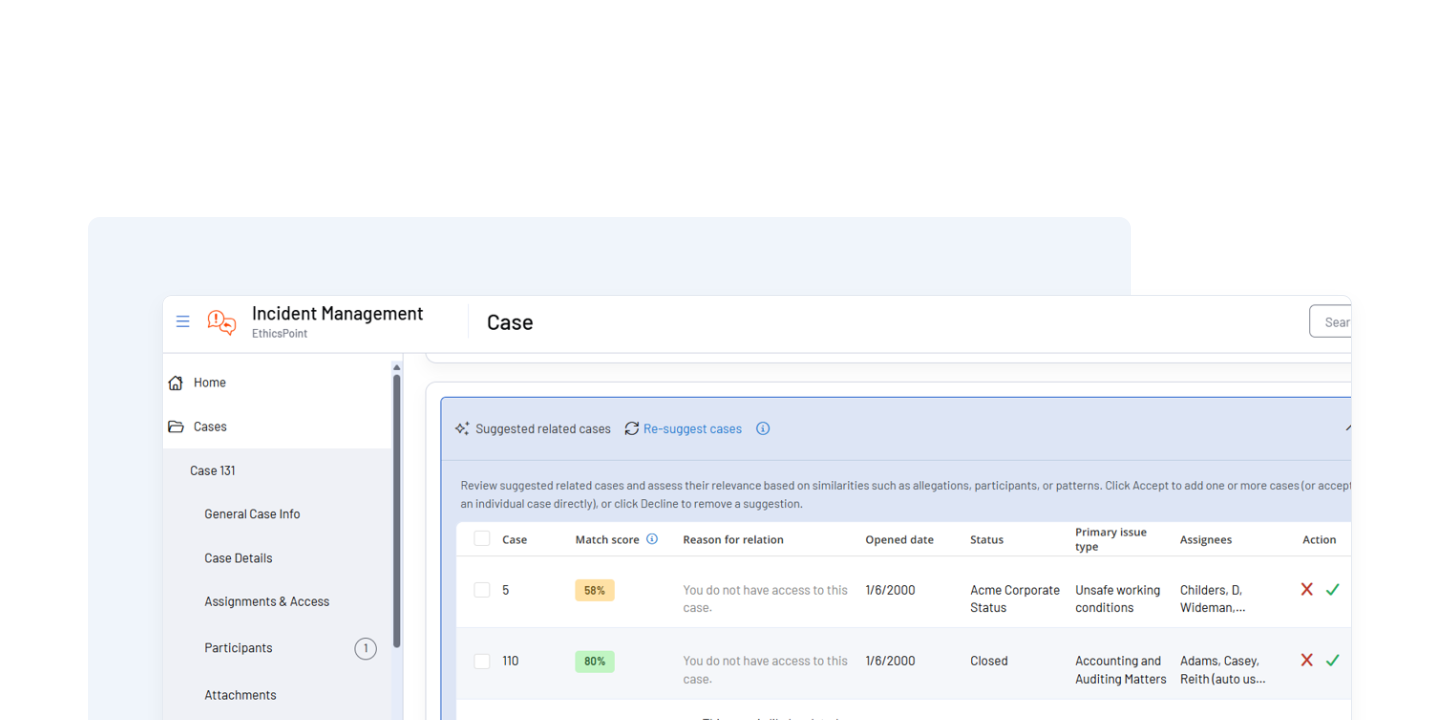
Datasheet
See how AI-assisted workflows help employees report concerns, help compliance teams classify reports, understand case details, improve documentation and manage investigations more efficiently, while keeping human judgment and oversight at the center.
Get the datasheet

Customer Story
As reporting volumes increased and regulatory complexity grew, Currys needed a way to manage compliance without expanding resources. By connecting incident management, risk workflows and regulatory intelligence in a single platform, the team gained the visibility and control needed to scale their program with confidence.
See their story

Webinar On-Demand
Discover how risk and compliance teams are using AI today to improve investigations, policy management, reporting, and oversight – and what’s next for AI-powered compliance.
View on demand

Webinar On-Demand
Employees won’t use a speak-up program they don’t know about—or trust. Join NAVEX to learn eight proven strategies for increasing employee speak-up awareness, building confidence in reporting channels and encouraging a stronger speak-up culture across your organization.
View on demand
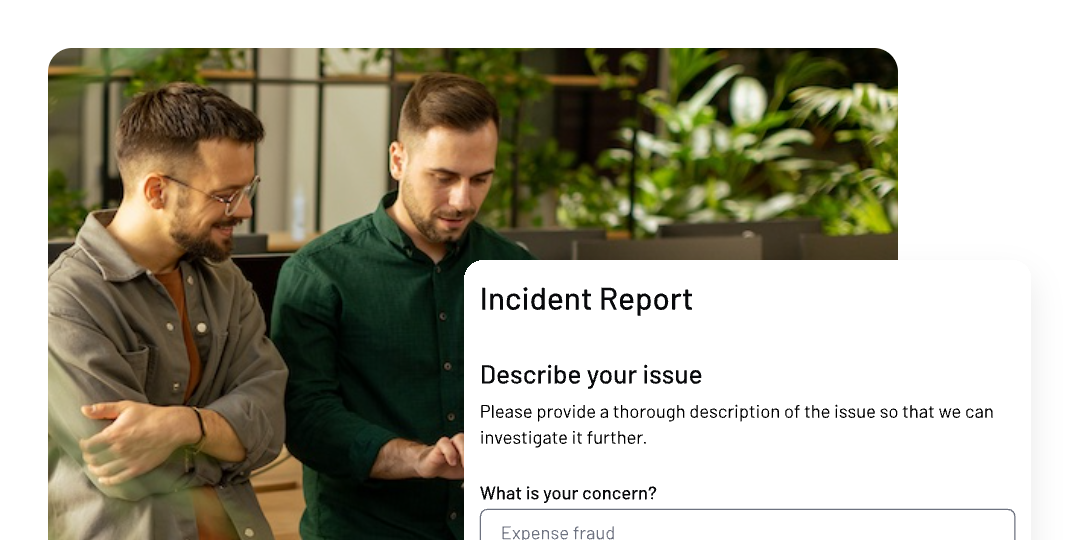
Datasheet
See how WhistleB supports secure reporting, case management and whistleblowing compliance with intuitive workflows built for organizations operating in Europe.
Get the datasheet

Datasheet
Discover how NAVEX supports global whistleblowing and incident reporting programs through trusted telephony providers, broad geographic coverage and reliable caller access.
Get the datasheet
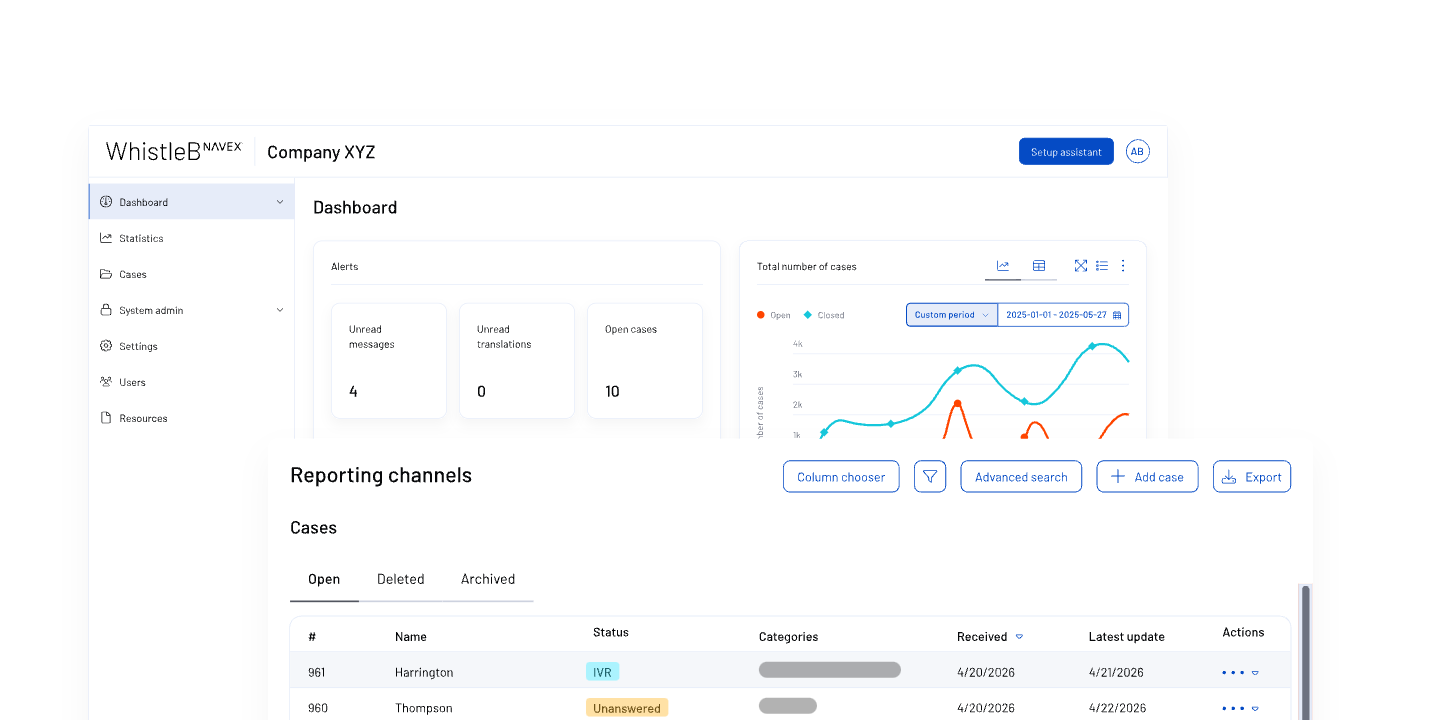
Datasheet
Designed for European compliance. Trusted worldwide.
Get the datasheet

White Paper
This white paper explores how organizations can better support whistleblowers and create a culture in which reporting is seen as an act of integrity, not disloyalty.
Get the white paper