Datasheet
GRC Insights™ Industry-Level Benchmark Reports
About this Datasheet
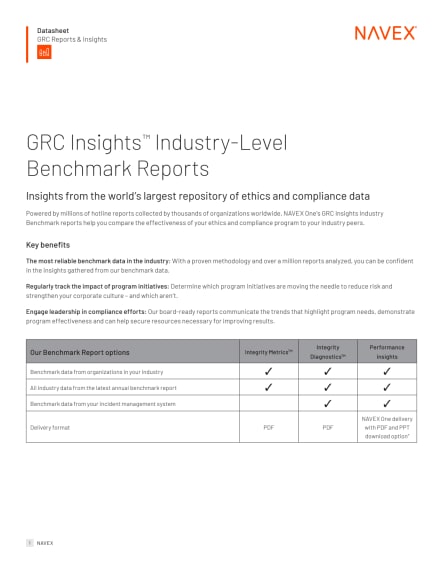
For organisations looking for a more customised benchmarking analysis we offer a deeper level of industry-specific insights to help you measure your ethics and compliance programme effectiveness and identify programme gaps and opportunities.
-
- For anyone responsible for:
- Ethics and compliance programme management
-
- What you'll learn:
- What the different compliance benchmarking offerings are within NAVEX’s Custom Benchmarking Services
- The key features, metrics and benefits of custom compliance benchmarking and the valuable insights your organisation will gain
- Organisations that received 10 or more reports in a given year
- Medians to limit the impact of outliers
- Ranges that cover the middle 80 percent of data points to further limit the impact outliers
- Means to provide insights to the distribution of data around the median
Read the Datasheet
GRC Insights™ Industry-Level Benchmark Reports
Insights from the world’s largest repository of ethics and compliance data
Powered by millions of hotline reports collected by thousands of organisations worldwide, NAVEX’s GRC Insights reports help you compare the effectiveness of your ethics and compliance programme to your industry peers.
Key Benefits
The Most Reliable Benchmark Data in the Industry: With a proven methodology and over a million reports analysed in our 2018 dataset alone, you can be confident in the insights gathered from our benchmark data.
Regularly Track the Impact of Programme Initiatives: Determine which programme initiatives are moving the needle to reduce risk and strengthen your corporate culture – and which aren’t.
Engage Leadership in Compliance Efforts: Our board-ready reports communicate the trends that highlight programme needs, demonstrate programme effectiveness and can help secure resources necessary for improving results.
Our Benchmark Report Options
Integrity Metrics | Integrity Diagnostics | Board Report | |
---|---|---|---|
Benchmark data from the organisations in your industry | ✓ | ✓ | ✓ |
All industry data from the latest annual benchmark report | ✓ | ✓ | ✓ |
Benchmark data from your incident management system | ✓ | ✓ | |
Delivery Format | PowerPoint & Excel |
Standard Benchmark Metrics Included:
• Reports per 100 Employees
• Allegations per 100 Employees
• Anonymous Reports
• Follow-ups to Anonymous Reports
• Overall Substantiated Reports
• Substantiated Named Reports
• Substantiated Anonymous Reports
• Case Closure Time (In Days)
• Reports Submitted via Hotline
• Reports Submitted via Web
• Reports Submitted via Other
• Accounting, Auditing & Financial Reporting
• Business Integrity
• HR, Diversity & Workplace Respect
• Environment, Health & Safety
• Misuse, Misappropriation of Corporate Assets
Benchmarking Data Methodology
NAVEX’s GRC Insights team queries, analyses and filters millions of reports collected by our thousands of hotline and incident management customers to calculate our industry leading benchmarks. All data is anonymised and each metric is calculated at the organisation-level before industry and all industry data points are calculated. To account for the inherent variation in cultures, environments and reporting methods, and ensure meaningful and accurate comparisons, our benchmark data is comprised of: