This year, NAVEX Global’s annual Incident Management Benchmark Report delivered a remarkable finding: For the first time in the history of the study, the median number of internal reports declined from 1.4 reports per 100 employees in 2019 to 1.3 reports in 2020.
How Does Your Report Volume Compare?
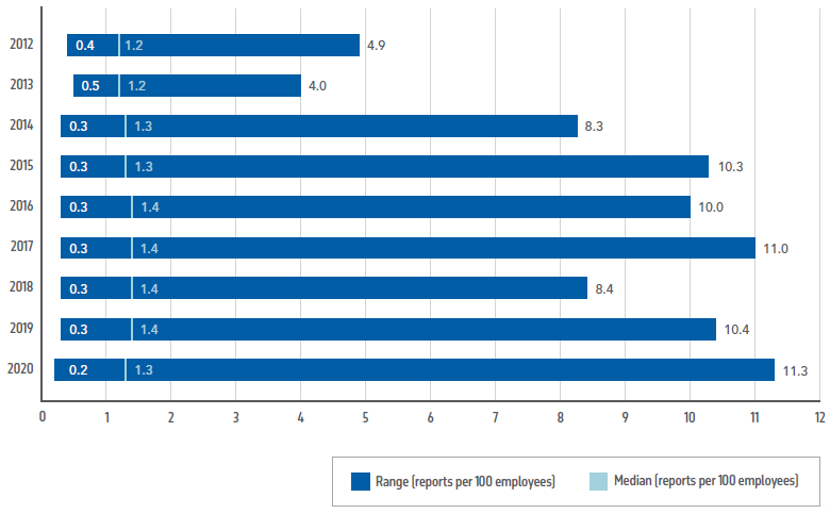
While apparently small, this shift is significant. Even the fraction of NAVEX Global’s database examined in the study – 1,325,957 reports received by the 3,027 organizations receiving 10 or more reports in 2020 – is so large that its year-over-year results are remarkably stable. This particular metric hasn’t budged since 2016, and was only 1.2 reports per 100 employees at its lowest ebb. So, this change of 0.1 isn’t just noise; it’s a meaningful shift reflective of real change.
But what does this change mean for your organization? That’s a difficult question, especially in a year as dynamic as 2021. The simple answer is that there is no simple answer; that it means something different to every organization. In fact, while most saw their report volumes drop, many businesses, particularly those that couldn’t shift to remote work, saw an increase. This resulted in report volumes ranging from 0.2 to 11.3 reports per 100 employees – the greatest range we’ve ever seen.
Three Questions to Ask
Given these differences, it’s important to consider key variables when applying the latest benchmarking data to your own internal report volumes. Begin by asking the following questions:
- How did your report volume change over time? First, look at your percentage of total report volumes on a month-to-month basis. What changes do you see?
Report Volume By Month
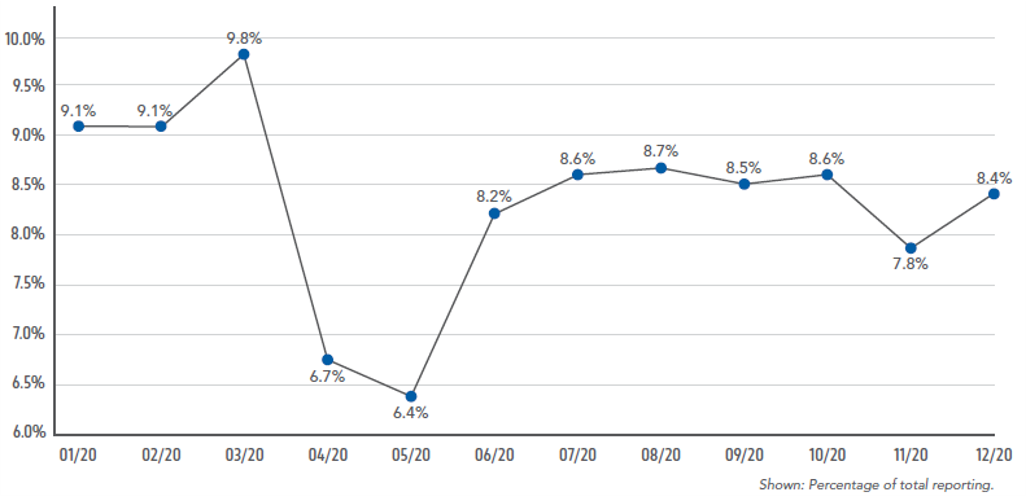
Overall, the 2020 Benchmark Report shows reporting spiked in March (when COVID-19 drove the U.S. to declare a state of national emergency), followed by precipitous declines in April and May. By June of 2020, report volumes had transitioned to something of a “new normal.” Knowing how your reporting changed over time, especially if you transitioned to a largely remote-work environment in response to COVID-19, can help you separate the signal from pandemic-related noise.
How does your reporting compare to industry peers? According to Gartner, 88% of organizations worldwide mandated or encouraged all their employees to work from home in the wake of the pandemic. However, employees in some businesses – including those in health care, manufacturing, transportation and warehousing – were unable to work remotely. These organizations generally saw their report volumes increase, even as businesses overall saw them drop. On the other end, firms in other key sectors such as finance and insurance went almost entirely remote, resulting in a vastly different reporting experience. While global metrics are informative, knowing how your business performed relative to industry peers can be essential to understanding organization’s experience and its implications for your compliance program. That’s why regulators and investigators recommend companies incorporate industry-specific lessons and benchmarking into their risk assessments and program audits.
How does your reporting vary by category? Also important when reviewing your incident management performance is to examine your reports by allegation category.
Monthly Reports By Allegation Category
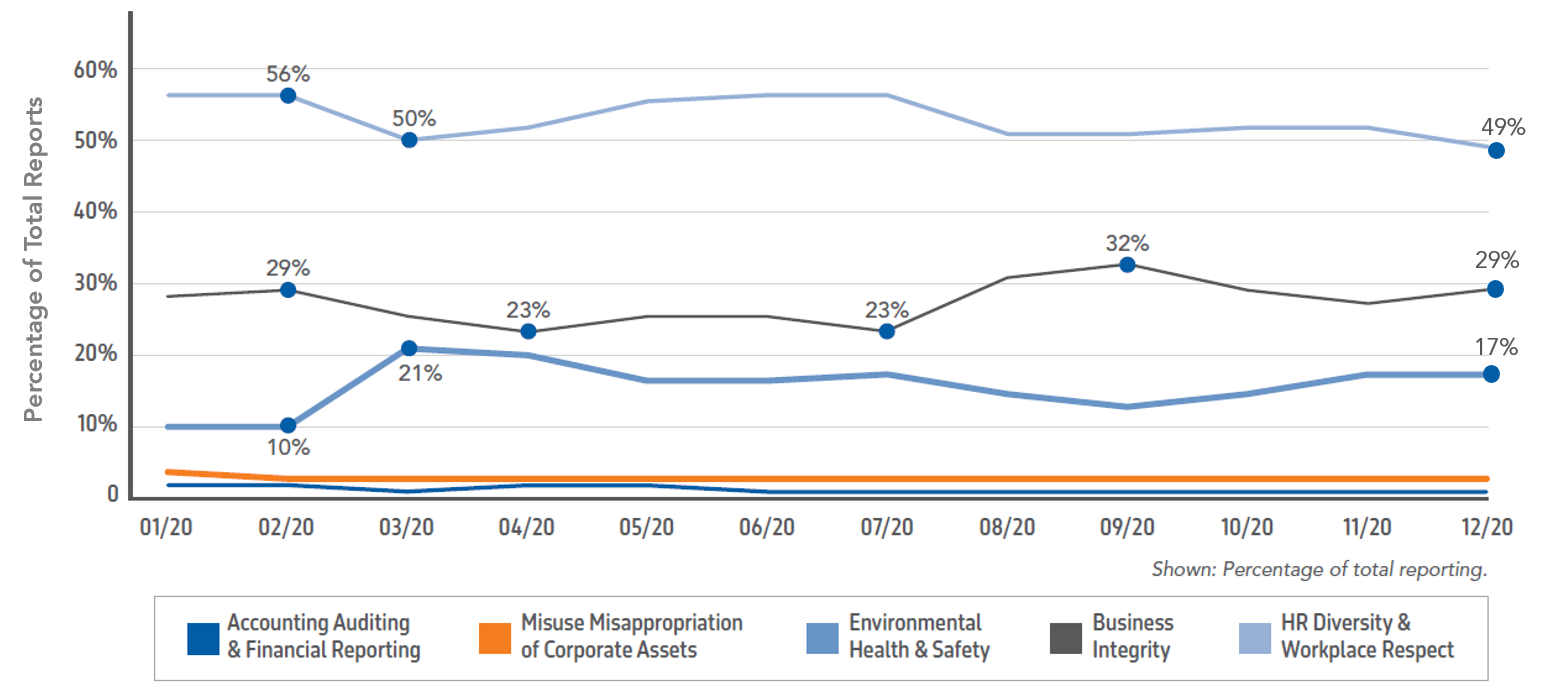
In 2020, we saw a doubling in environment, health and safety (EHS) reports as a share of total reporting as COVID-19 took hold. Business integrity reporting, meanwhile, rose in the late summer – an increase that coincided with the stabilization of monthly report volumes and growing public interest in COVID-related corruption. Like changes over time and across industry, differences in what types of reports you are receiving can offer insight into your organization’s compliance and cultural health.
Fewer Reports Doesn’t Mean Fewer Incidents
Even after placing your report volume in the proper context, assessing its impact and implications can be difficult. Too often, the default interpretation of declining report volumes is uncritically positive – that fewer reports means fewer incidents.
Of course, experienced compliance professionals understand that this is not necessarily the case. In fact, recent studies indicate the reverse to be true. Over the past few years, researchers from George Washington University and the University of Utah have found correlations between increased report volumes and a variety of positive business outcomes, including increased profitability and productivity, fewer lawsuits, lower litigation costs and regulatory fines, reduced reputational risk, and fewer external reports.
That last metric is especially important in light of the most recent reporting from the Securities and Exchange Commission. In its 2020 report to congress, the SEC confirmed its Office of the Whistleblower received 6,911 tips in the last fiscal year – a 33% increase over FY2019. Those tips resulted in record-setting awards paid out to the largest number of whistleblowers in the program’s history.
Whistleblower Tips to the SEC
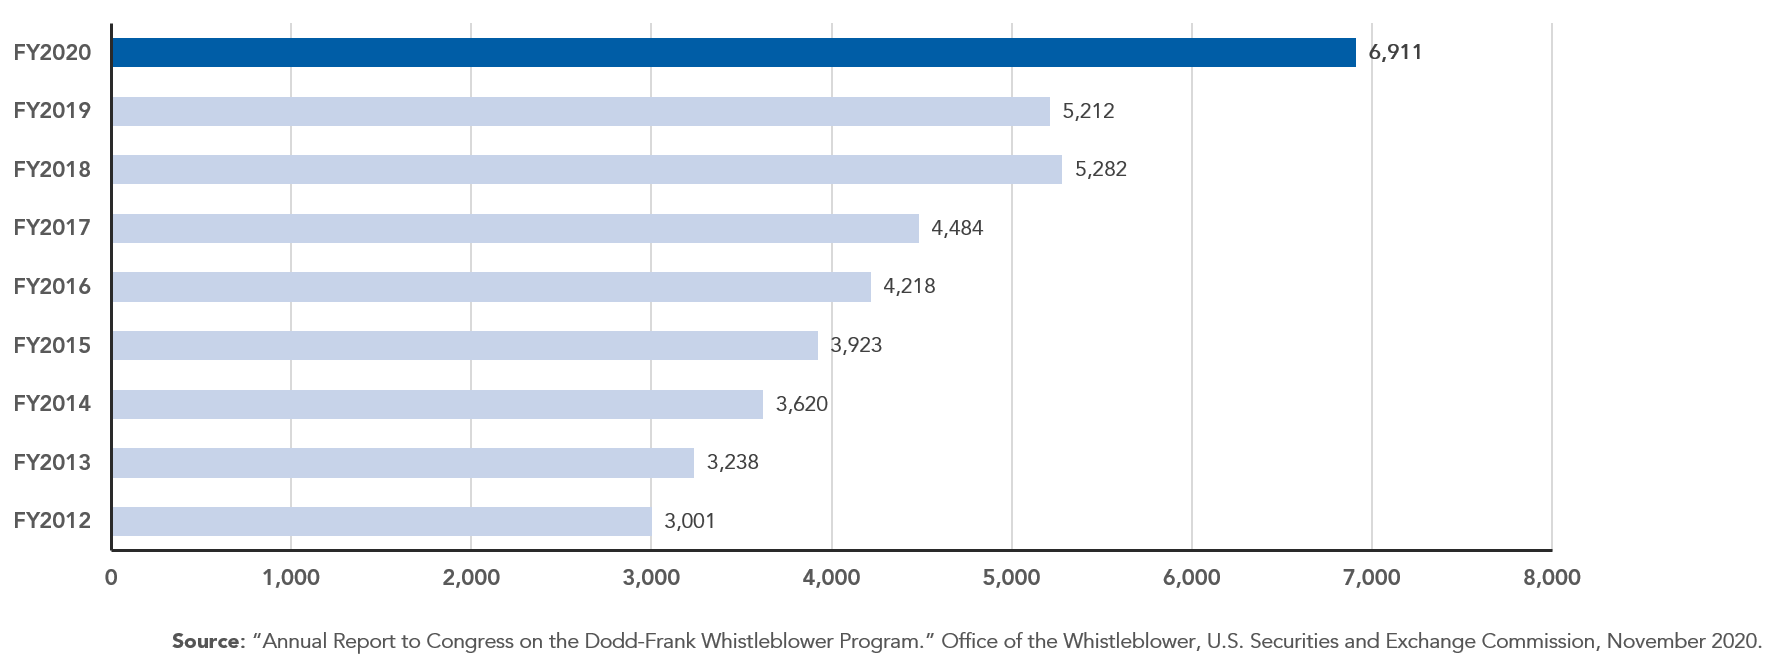
These unprecedented highs in external reporting should give caution to anyone inclined to believe that the lower report volumes we saw in 2020 were the result of fewer incidents. In fact, they most likely mean that compliance programs will have to work even harder to encourage employees to speak up about problems and abuses they witness or receive. Otherwise, organizations risk first learning about those issues through lawsuits, investigations, or the evening news.
This year’s Benchmark gives some valuable insights into how you can equip your incident management program to best capture reporting. Don’t know where to begin? Start by:
- Tracking all sources. Year after year, we consistently see organizations that track reporting from all sources, including open-door and manager submissions, see higher median report volumes than those which only track web and hotline reports. Ensuring your incident management system encompasses all types of reporting is critical to maintaining a healthy incident management function.
Reports per 100 Employees
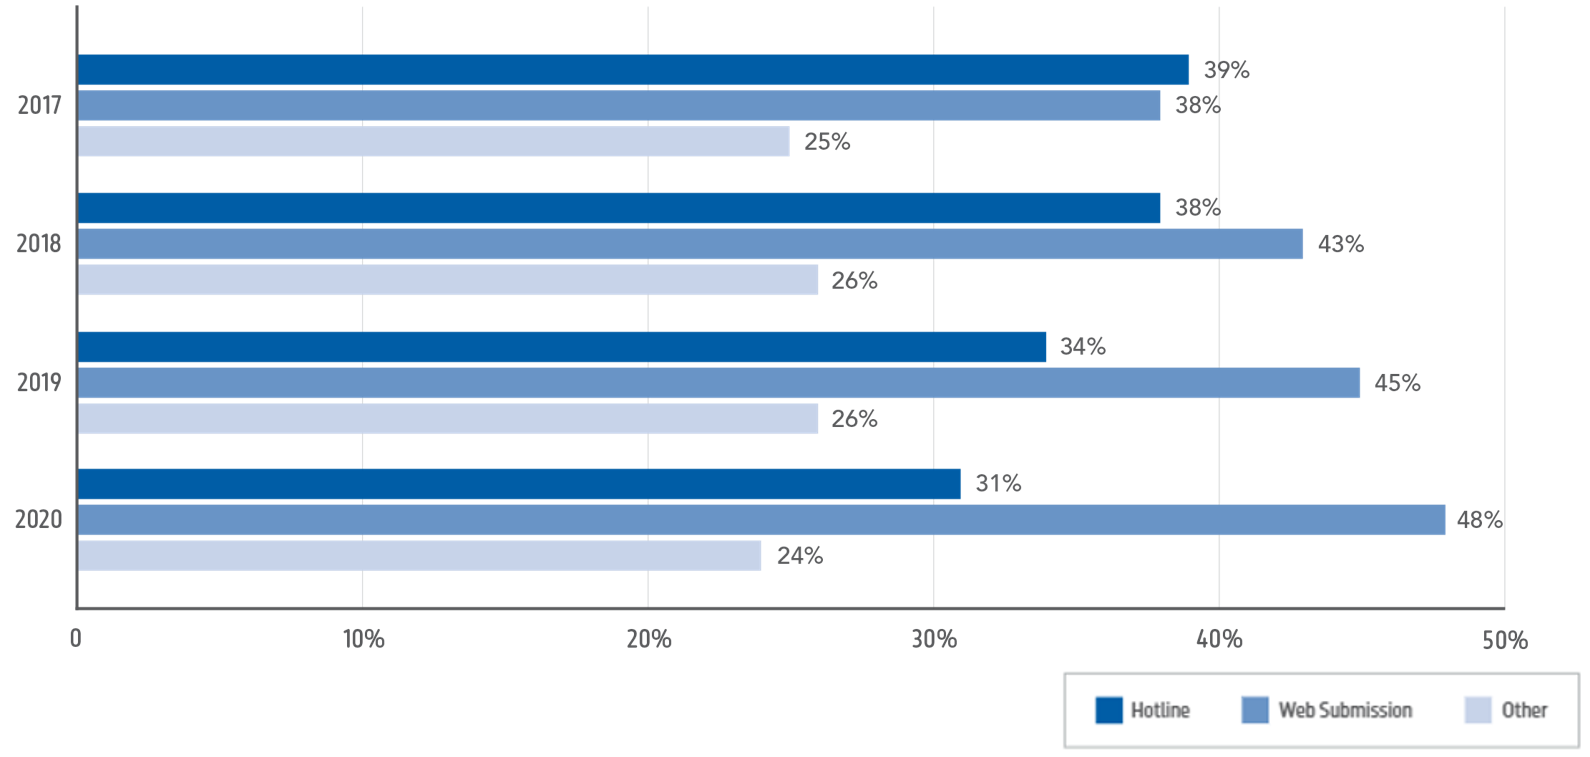
- Leveraging non-hotline reporting. Over the past several years, we have witnessed a steady decline in the percentage of reports received via traditional hotlines. This was even true during the pandemic, when remote work made in-person forms of reporting more difficult. Web reporting, in contrast, now comprises a plurality of all reporting. Make sure your employees are aware of – and comfortable with – all the ways in which they can report problems, including and especially your online reporting system.
Reporting Intake Method Comparison (Median)
Ultimately, this year’s Benchmark data validates what compliance professionals have always known – That providing a robust and trusted incident management function is foundational to a successful program. By examining their report volumes across time, type and industry, compliance can better evaluate their own performance and identify potential blind spots – helping to ensure not just regulatory compliance but business excellence.